I had some difficulties with previous post due the fact that I did not get precise coordinates for mapping, and I finally try this alternative code, which gave me better results and I made final maps for each year from dispatch file.
Please find below detail explanation with code.
Script 1:
import re, os


source = "C:/Users/Tatjana Smiljnic/Desktop/univie-tnt-2019.github.io/Lesson_10/tgn_xml_0619/" # xml files
oldPath = "C:/Users/Tatjana Smiljnic/Desktop/univie-tnt-2019.github.io/Lesson07/wget-activehistory/" # first dispatch
newPath = "C:/Users/Tatjana Smiljnic/Desktop/Lesson_10_new/" # new path to save files

lof = os.listdir(oldPath)

def generate(filter): #function where filter will be our input (the year)

    topCountDictionary = {} #creating dictionary for tgn-number and frequency
    counter = 0 #general counter to keep track of the progress

    for f in lof: # looping through our all XML files
        if f.startswith("dltext"): # fileName test
            with open(oldPath + f, "r", encoding="utf8") as f1:
                text = f1.read() # getting the content of the file
                text = text.replace("&", "&") # cleaning the content of the file (that we do not need)
                # find the date:
                date = re.search(r'<date value="([\d-]+)"', text).group(1)

                if date.startswith(filter): # making sure the output only includes data for the input year
                    for tg in re.findall(r"(tgn,\d+)", text): # finding the tgn info
                        tgn = tg.split(",")[1] # reducing the tgn informationen to the tgn number
                        # making a dictionary with tgn number as key and counting the frequency of its occurence:
                        if tgn in topCountDictionary:
                            topCountDictionary[tgn] += 1
                        else:
                            topCountDictionary[tgn]  = 1

    top_TSV = [] #creating a list to write a csv-file
    # creating the list with our data:
    for tgnnumber, frequency in topCountDictionary.items():
        val = "%09d\t%s\t01-01-%s" % (frequency, tgnnumber, filter) # defining the precise syntax for the csv file
        top_TSV.append(val) # putting the information into the list

    # saving the data in csv format:
    header = "freq\ttgn\ttimestamp\n"
    with open("dispatch_toponyms_%s.tsv" % filter, "w", encoding="utf8") as f9:
        f9.write(header+"\n".join(top_TSV)) # wirting the file into numerous lines incl. a header-line

# using our function for different years:
generate("1861")
generate("1862")
generate("1863")
generate("1864")
generate("1865")

def generateTGNdata(source): # function taking in the XML-files

    lof = os.listdir(source) # creating a list out of the files

    tgnList = []
    tgnListNA = []
    count = 0
    print("Looping through list of XML files now")
    for f in lof: # looping through the list of files
        if f.startswith("TGN"): # fileName test

            with open(source+f, "r", encoding="utf8") as f1: # opening and reading the files
                data = f1.read()

                data = re.split("</Subject>", data) # putting the content of the file into a list and splitting for every Subject

                for d in data: # looping through the whole list of Subjects
                    d = re.sub("\n +", "", d)

                    if "Subject_ID" in d:
                        # SUBJECT ID
                        placeID = re.search(r"Subject_ID=\"(\d+)\"", d).group(1)
                        # NAME OF THE PLACE
                        placeName = re.search(r"<Term_Text>([^<]+)</Term_Text>", d).group(1)
                        # COORDINATES

                        if "<Coordinates>" in d:
                            latGr = re.search(r"<Latitude>(.*)</Latitude>", d).group(1)
                            declat = re.search(r"<Decimal>(.*)</Decimal>", latGr).group(1)
                            # extracting degrees and minutes
                            degrees = re.search(r"<Degrees>(.*)</Degrees>", latGr).group(1)
                            minutes = re.search(r"<Minutes>(.*)</Minutes>", latGr).group(1)
                            # calculating the decimal with dividing minutes  by 60 which will give us a float decimal (R)
                            # try and catch in case any of the used variables is empty.
                            try:
                                minlat = float(minutes)/60
                                # than add the degree and the result of the calculation and make a string out of it str(float(D)+R)
                                lat = float(degrees)+minlat
                                lat = str(lat)
                                if "-" in declat: # as decimal is showing the direction with both positive and negative numbers
                                    lat = "-"+lat # a minus has to be added in front of some values, to have unique value and precise data
                            except ValueError: # because some tags are empty
                                # print("Latitude can not be converted to a float", d). Everything that empty is should be recognized as NA and we do not use this data for our final mapping
                                lat = "NA"

                           # same for longitude:
                            lonGr = re.search(r"<Longitude>(.*)</Longitude>", d).group(1)
                            declon = re.search(r"<Decimal>(.*)</Decimal>", lonGr).group(1)
                            degrees = re.search(r"<Degrees>(.*)</Degrees>", lonGr).group(1)
                            minutes = re.search(r"<Minutes>(.*)</Minutes>", lonGr).group(1)
                            try:
                                minlon = float(minutes)/60
                                lon = float(degrees)+minlon
                                lon = str(lon)
                                if "-" in declon:
                                    lon = "-"+lon
                            except ValueError:
                                # print("Longitude can not be converted to a float", d)
                                lon = "NA"
                        else:
                            lat = "NA"
                            lon = "NA"

                        tgnList.append("\t".join([placeID, placeName, lat, lon])) # finally, creating a list of all the places with coordinates
                        # print(tgnList)

                        if lat == "NA" or lon == "NA":# making a list of all the places without coordinates (should be printed, but we do not use for final mapping)
                            # print("\t"+ "; ".join([placeID, placeName, lat, lon]))
                            tgnListNA.append("\t".join([placeID, placeName, lat, lon]))

    # saving the files:
    header = "tgnID\tplacename\tlat\tlon\n" # headers delimited by a TAB
    with open("tgn_data_light.tsv", "w", encoding="utf8") as f9a: # saving the list with coordinates
         f9a.write(header+"\n".join(tgnList))

    with open("tgn_data_light_NA.tsv", "w", encoding="utf8") as f9b: # saving the list of places without coordinates
         f9b.write(header+"\n".join(tgnListNA))

    print("TGN has %d items" % len(tgnList)) # print
    print("%d items do not have coordinates" % len(tgnListNA)) # print

generateTGNdata(source)
Script 2:
import re, os, csv

# loading TGN data into a dictionary (with a function):
def loadTGN(tgnTSV): # defining the function
    with open(tgnTSV, "r", encoding="utf8") as f1: # opening the previously created (and saved) tgnTSV-file
        data = f1.read().split("\n") # creating a variable containing the data of the tgnTSV-file separated into lines
        dic = {} #making the dict we will use
        # looping through every line:
        for d in data:
            d = d.split("\t") # splitting the data with TABs
            dic[d[0]] = d # filling the dict with the keys and values

    return(dic)

# matching our data-files with the tgn-data:
def match(freqFile, dicToMatch): # defining the function and its intakes
  # opening the previously made and saved freqFile:
    with open(freqFile, "r", encoding="utf8") as f1:
        data = f1.read().split("\n")
        # creating all the lists we need:
        dataNew = []
        dataNewNA = []
        count = 0 # general counter to keep track of the progress

        for d in data[1:]: # looping through our toponymes-file
            tgnID = d.split("\t")[1] # getting the tgn-number so we can compare it to the one in the dict, start counting the columns with 0
            freq  = d.split("\t")[0] # getting the frequency so we can write it into a csv
            timestamp = d.split("\t")[2]
            if tgnID in dicToMatch: # matching places to the dict by tgn-number
                val = "\t".join(dicToMatch[tgnID]) # variable for the entry in the dict
                val  = val + "\t" + freq + "\t" + timestamp # putting the frequency and the timestamp to the entry in the dict

                if "\tNA\t" in val: # creating lists with the toponymes without and with  coordinates
                    dataNewNA.append(val)
                else:
                    dataNew.append(val)
            else:
                print("%s (%d) not in TGN!" % (tgnID, int(freq))) # states which tgnID could not be found and what frequency it had
                count += 1
    # defining the names of the header:
    header = "tgnID\tplacename\tlat\tlon\tfreq\ttime_stamp\n"
    #creating a file with all the toponymes with their coordinates:
    with open("coord_"+freqFile, "w", encoding="utf8") as f9a:
        f9a.write(header + "\n".join(dataNew))
    #creating a file with all the toponymes without coordinates:
    with open("coord_NA_"+freqFile, "w", encoding="utf8") as f9b:
        f9b.write(header + "\n".join(dataNewNA))

    print("%d items have not been matched..." % count) # print all the items that could not been matched


dictionary = loadTGN("tgn_data_light.tsv") # variable for the Getty Gazetteer we previously cleaned up
# running and matching the two functions using our toponyms and the "tgn_data_light.tsv"
match("dispatch_toponyms_1861.tsv", dictionary)
match("dispatch_toponyms_1862.tsv", dictionary)
match("dispatch_toponyms_1863.tsv", dictionary)
match("dispatch_toponyms_1864.tsv", dictionary)
match("dispatch_toponyms_1865.tsv", dictionary)
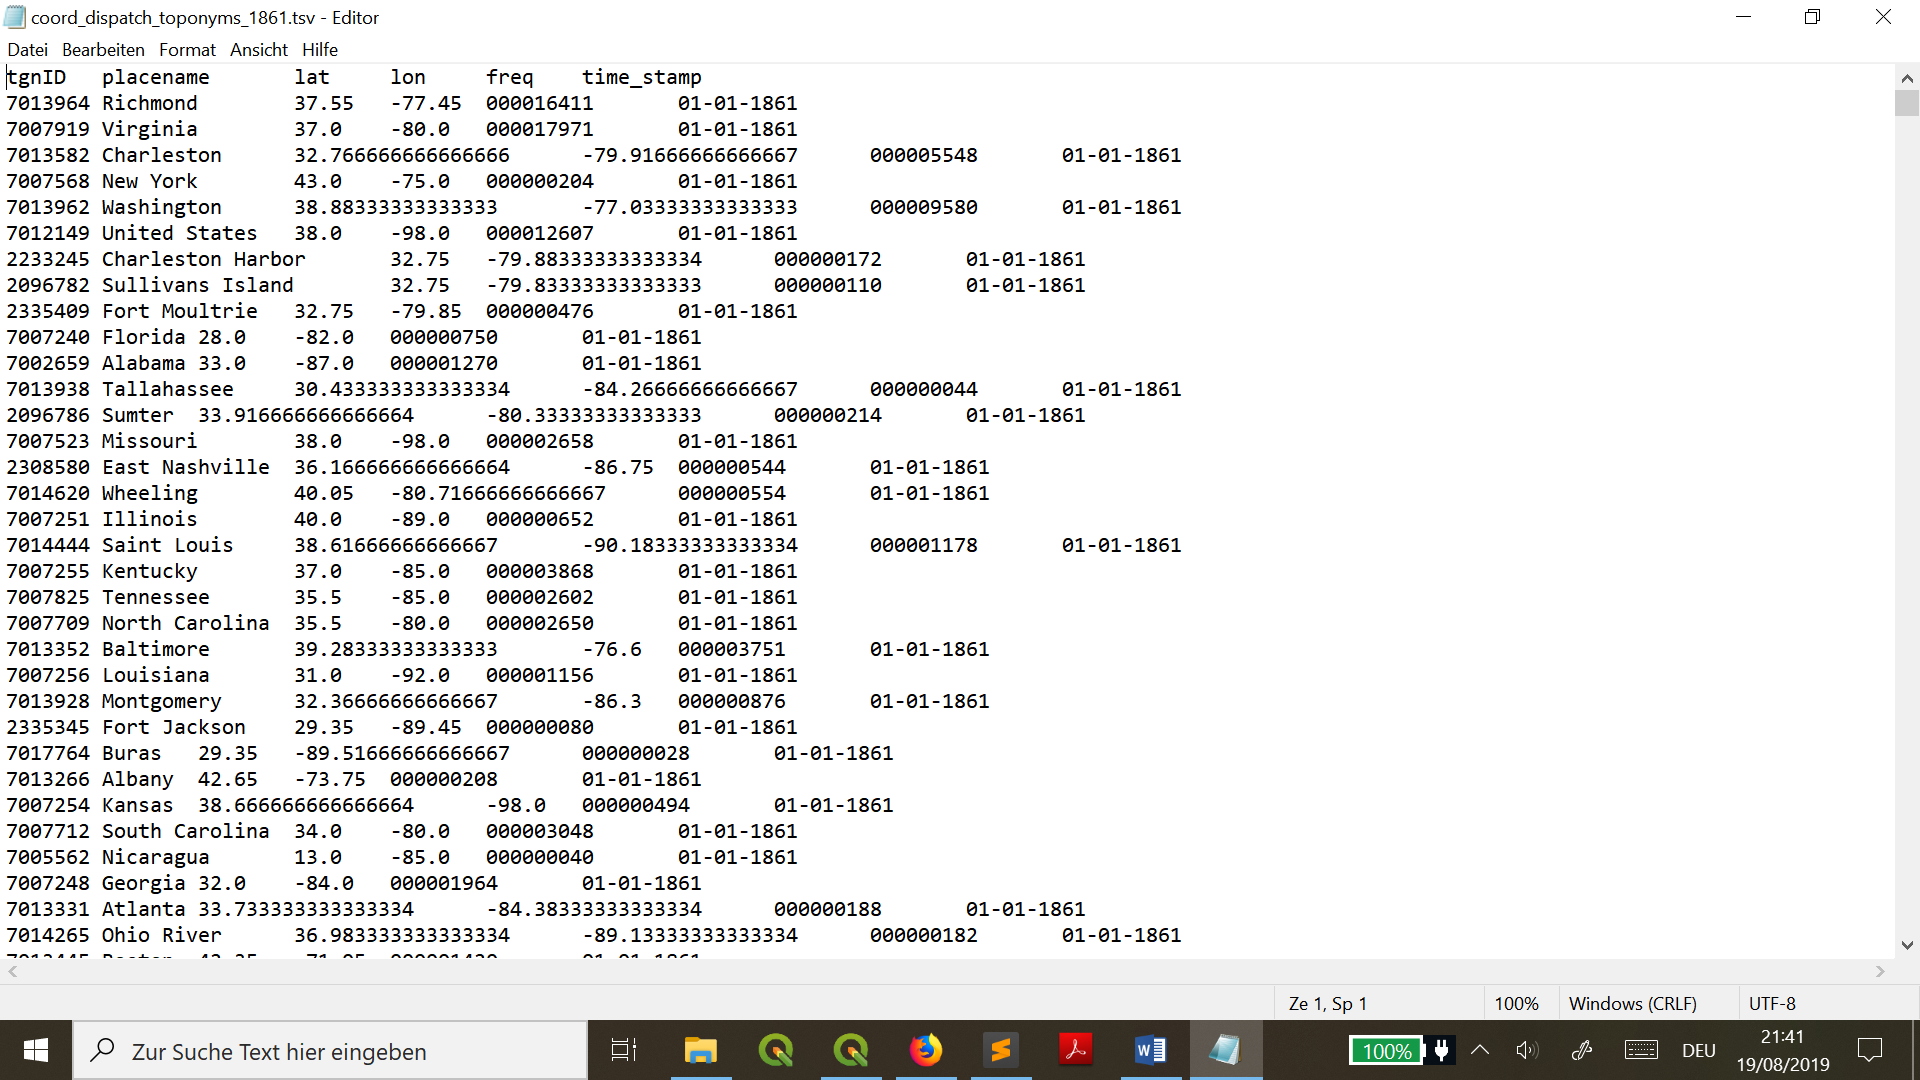
Results:
With this results (picture below) we can see that coordinates are more precise to make final mapping in QGIS.
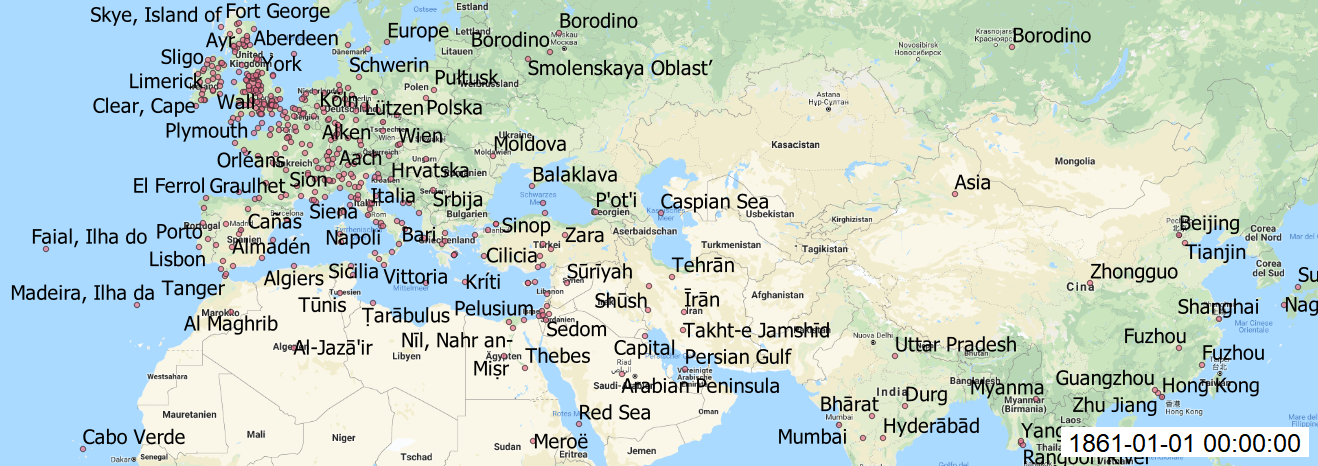
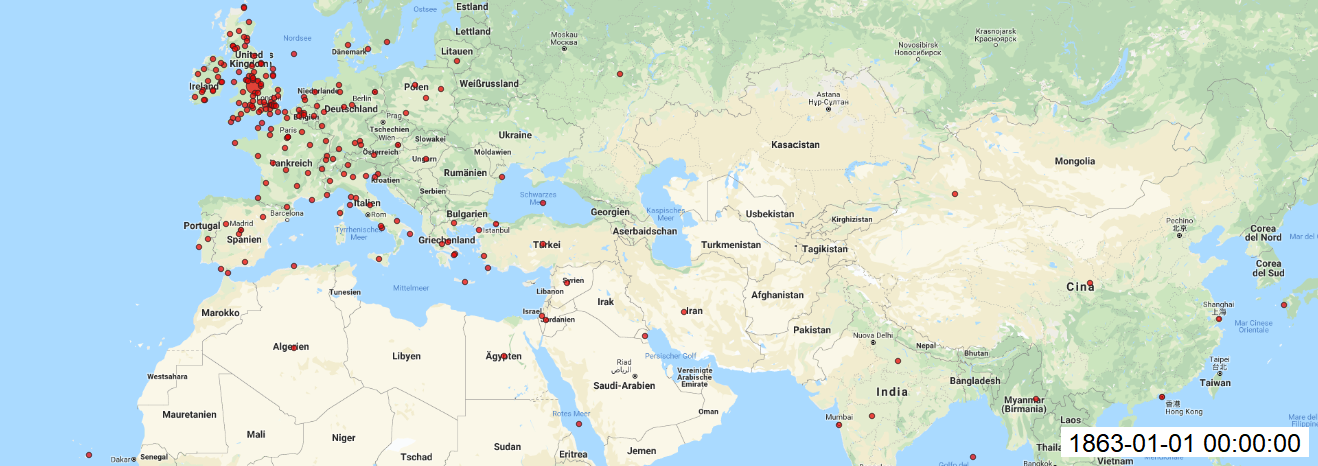
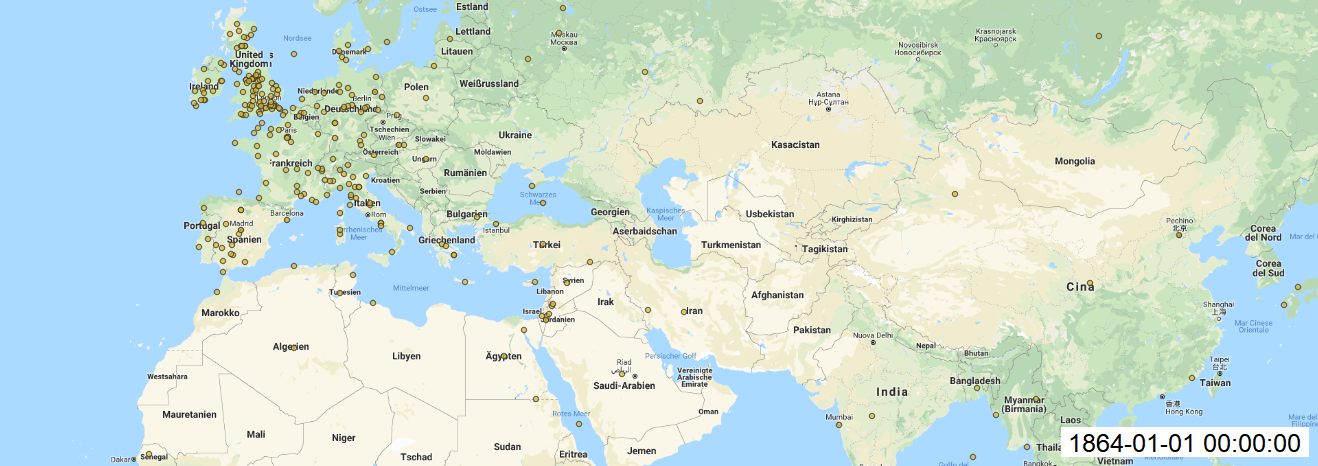
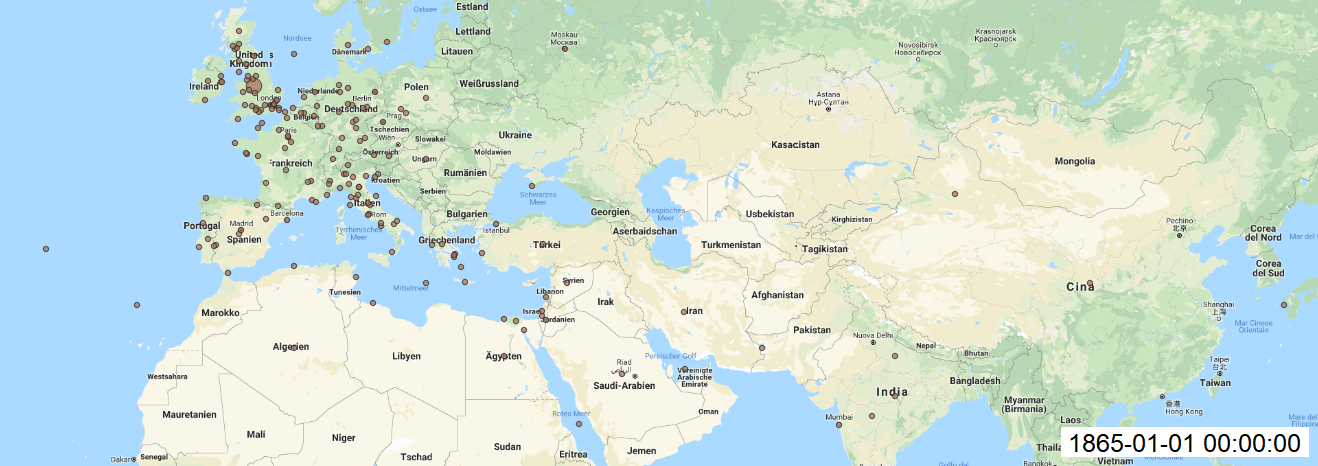
Maps:
In QGIS, I made add Layer as Delimited Text Layer and styled the layer with size of circles, transparency, labels for each year. Finally, I installed Time Manager plugin to animate my maps over time and saved each build. I created gif file to see changes over time.

As well each map created with Time manager plugin.